Does this Mongo Database Make Me Look Fat?
“Big Data” represents a large reason for data collection and the importance of its preservation in Society’s Genome.
The MIT Technology Review highlights a study on obesity using statistical methods. Data Mining Is Revolutionizing Our Understanding of Human Weight Change
Today we get an answer thanks to the work of John Lang at the University of Waterloo in Canada and a couple of pals. They’ve crunched through the anonymized medical records of 750,000 patients in the Chicago area from 1997 to 2014. And their findings are something of a surprise.
The data looks at body mass index, defined as mass divided by height squared and a standard measure of relative body weight. Individuals with a BMI of less than 18.5 are underweight, a normal weight is 18.5 to 25, overweight is 25 to 30, and anyone with a BMI higher than 30 is obese.
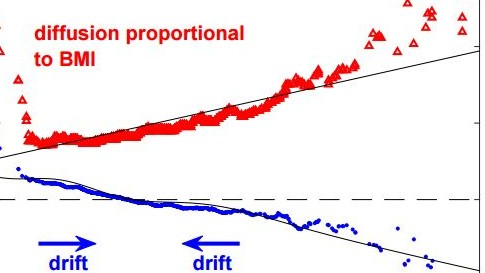
Lang and company have found some counterintuitive patterns. For example, the data does not back up the idea that everyone is on the same slippery slope. On overage, the population’s BMI increases over time and underweight people certainly tend to increase their BMI. But the overweight and obese tend to reduce their BMI over time. “On short timescales of about a year, the BMIs of individuals in a human population show a natural drift on average toward the center of the BMI distribution,” says Lang and company.
The study contradicts some widely held beliefs. There is far less correlation to socioeconomic status and the idea of “an inescapable, slippery slope of weight gain” is disputed (your blog author excluded!). Classic statistics like regression to the mean play a larger role, as does a bias to larger swings at the high end.
Excellent data analytics forecasting, in my opinion. Now, will somebody bring in doughnuts, please?

